EISCAT_3D Operation Illustration
The legacy EISCAT systems include tri-static capabilities with a transmitter/receiver in Ramfjordmoen, Norway (Near Tromsø) and receive-only antennas in Kiruna, Sweden and Sodankylä, Finland. These systems utilize large, reflector-based antennas and highly sensitive receivers to measure the ionospheric plasma in and around the auroral zone. In the cartoon test40legmov (Legacy), the Ramfjordmoen antenna is pointed vertically and the receive sites are pointed to intersect the transmitted pulse at 250 km altitude. In this and all the movies, the transmitted pulse is colored red, the intersection volumes are green dots, and the receive signals are green lines.
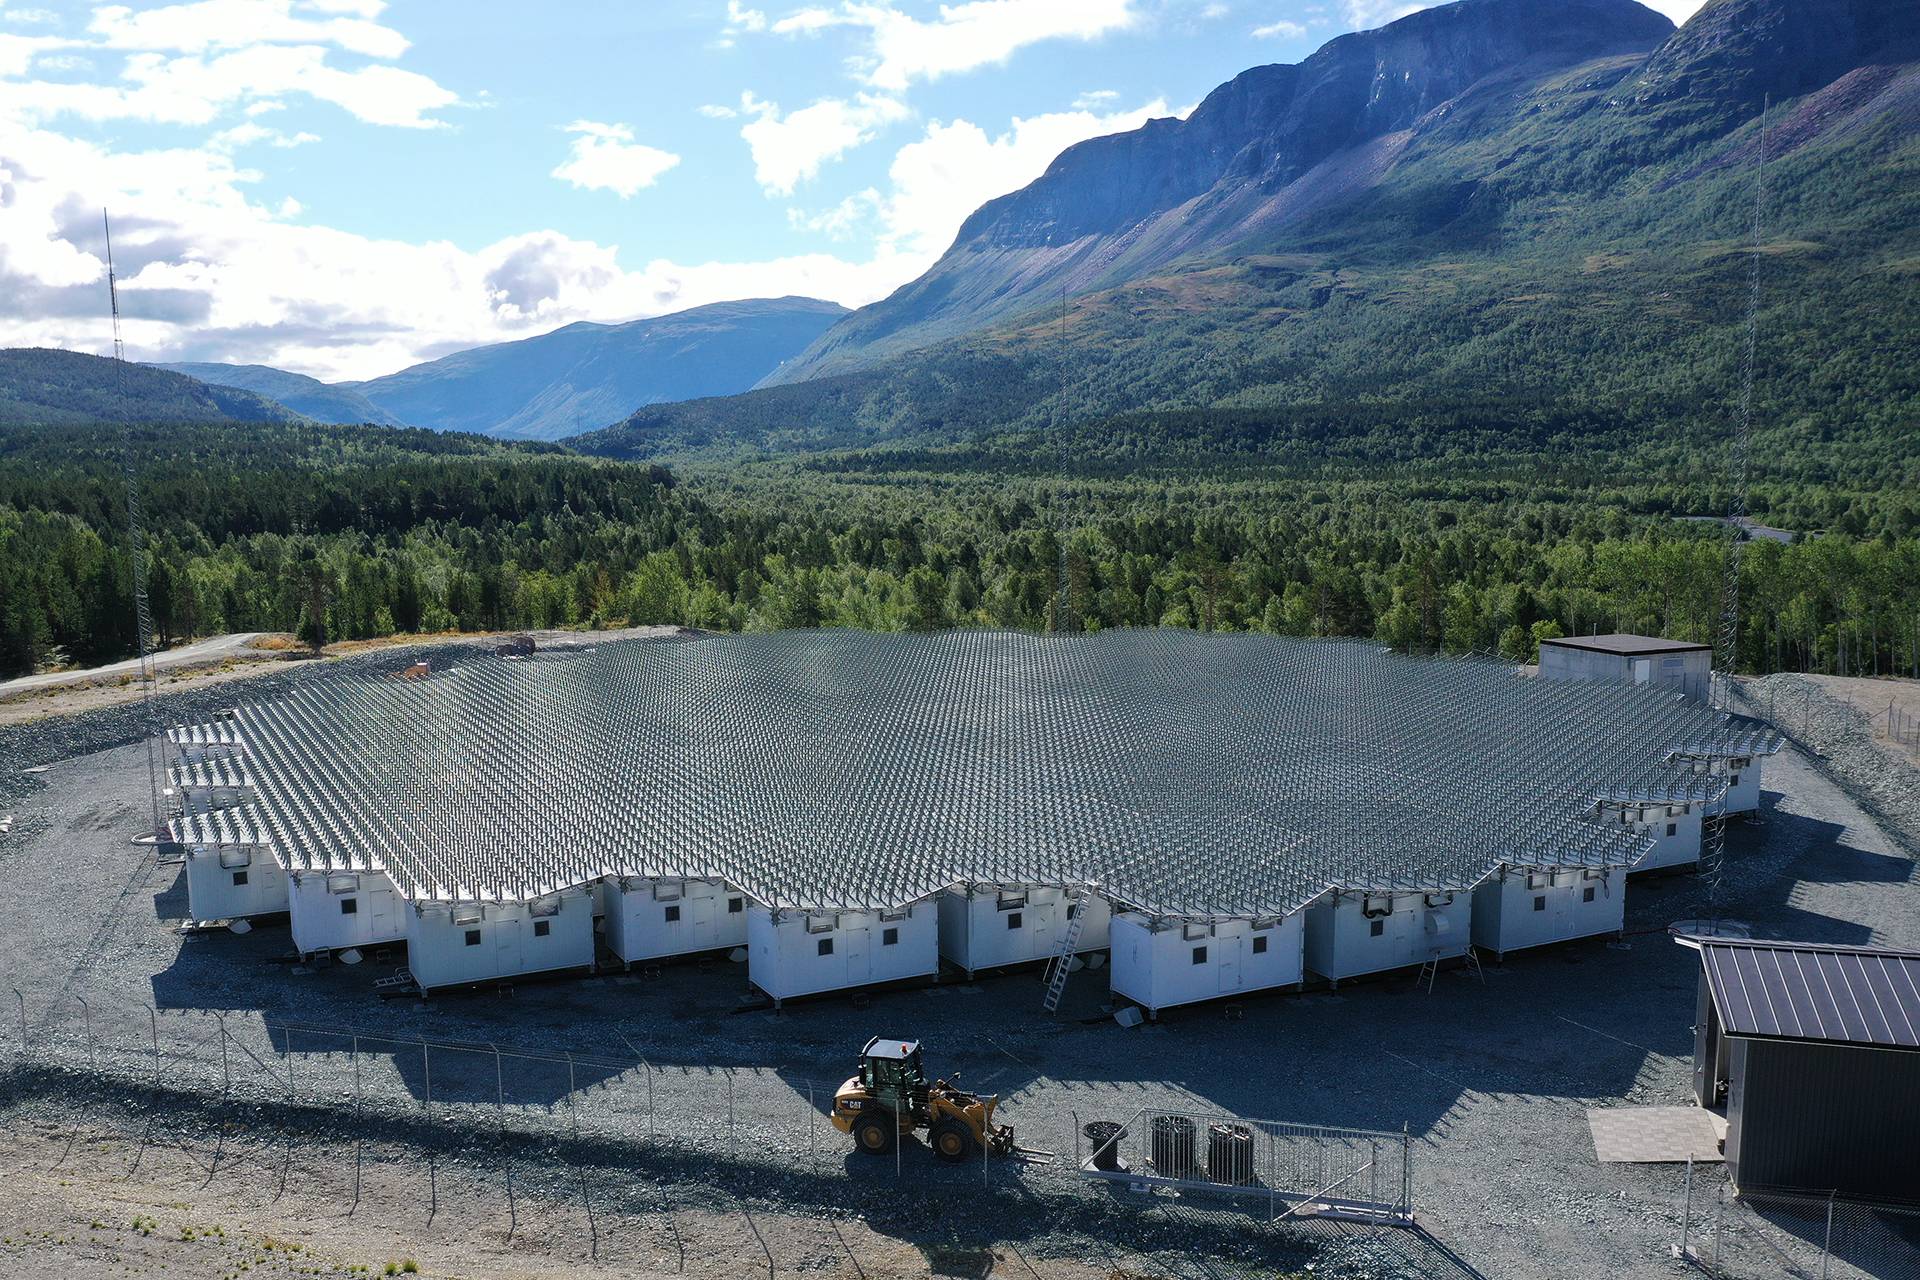
With EISCAT_3D, the receive sites will be able to produce multiple simultaneous beams and, thus, support multiple intersection volumes. Test40mov (1 User, 1 Dir) illustrates this for the stage 1 implementation. Here, the transmitter (in Skibotn, Norway) sends pulses vertically and the receivers in Skibotn, Norway, Karesuvanto, Finland, and Kaiseniemi, Sweden all look at a set of altitudes. The received signals arrive at the Karesuvanto and Kaiseniemi sites from different directions and, as such, they can be separated by forming beams. Note that the scattering angles for the measurements are quite different at low altitudes vs. high altitudes. At higher altitudes, the scattering angles are more similar and as a result the system will have a more difficult time estimating velocity vectors from the Doppler shifts. As a result, the stage 1 system is much more optimal for lower altitude (E-region) measurements.
Another significant improvement with EISCAT_3D is the ability to transmit sequential pulses in very different directions. With the legacy EISCAT systems, looking in different directions entails moving tons of antenna hardware to point differently. For EISCAT_3D, pointing is done electronically and, as a result, much more flexibility is obtained. This can be seen in the cartoon test41mov (1 User, 5 Dir) which shows sequential pulses being sent in 5 different directions. In this example a full sequence takes just 25 milliseconds before repeating.
With the legacy systems, experiments can, practically speaking, only be run by one user at a time. This is due to the fact that the antenna pointing directions cannot generally be time-sliced (shared) in a way that makes sense when the ionospheric variability is taken into account. This is not the case for EISCAT_3D, which can be shared as long as none of the users needs the full time resolution of the system (after integration). This concept is illustrated in test42mov (2 Users) in which User 1 utilizes 5 pulses (in 25 milliseconds) and then User 2 sends and receives 8 pulses (in 40 milliseconds) before returning to User 1’s set. In principle, this can be extended to a large number of simultaneous users, though each user must sacrifice time resolution.
EISCAT_3D will also, with some limitations, be able to react to conditions either detected externally or in its own measurements. Consider, for instance, a situation where Users 1 and 2 are sharing the system in a pre-determined way with User 1 receiving 35 pulses followed by User 2 receiving 40 pulses and then returning back to User 1. If, for instance, a meteor is measured in User 1’s data, User 3 can step in and inject 12 pulses with a different pulse length, pulse repetition frequency, and look direction. The system is then returned to the standard sharing sequence for Users 1 and 2. This concept is shown in test43mov (Interrupt). A major limitation here is that the interrupt sequences must be pre-programmed and that a detection from one of User 1’s pulses cannot immediately result in User 3 taking over. The basic limitation is the communication time between sites – remember that the illustrated pulses are traveling at the speed of light and, thus, telling the receive sites that a new sequence is to be initiated takes some time (possibly on the order of 1 second).
Finally, EISCAT_3D will look in three dimensions. The cartoon in test44mov (Grid) shows one way this might be done by simply scanning the transmit pulses through a grid sequence. The grid of green dots at the end of the cartoon show points where both scalar and vector plasma parameters are produced. It should also be noted that in all these cartoons the grid spacing is set intentionally large for easy viewing. In reality, the receive sites are capable of forming up to 100 simultaneous beams, thus yielding a much greater coverage along each transmitted beam.


